Wisconsin
Wisconsin’s Numbers[1]
Over the last couple of days, Tom presented a variety of metrics regarding Milwaukee and Madison. Overall, the markets do well. Madison sparkles and Milwaukee is about average. Per requests from leaders in both communities, this blog post will review some of the information and act as a holding spot for the information – including the presentation.
Expected Value Rank
Figure 1.
Over the last three years, Wisconsin has finished last in the Kauffman Index which is a measurement of startup activity. That index is driven by some rightish measurements. However, a substantial chunk is tied to the unemployment survey – the Current Population Survey - which has some challenges in the margins. This is a fine methodology but too narrow to really reflect the health of a startup ecosystem alone, and so, by the way, is the data in this report. An alternative (albeit narrow measurement) is to compare expected values of financings. Specifically, Chapman and Company used the SBA loan data that is available from the SBA for the period from 2010-2017.
Chapman and Company analyzed how the state performed compared to the expected value based on the state’s population. Over the full-time (2010-2017), Wisconsin was ranked sixth for states that have created more SBA loan value above expected value. This equates to nearly $1.4B of economic activity above the average. That is outstanding. In 2017, Wisconsin exceeded expected value by approximately $58.7 million. While the state fell to the 11th ranking, the central point is that Wisconsin’s startup activity is significant and not even close to 50th by most metrics.
However, one central discovery that Chapman and Company has had looking at this SBA data for about a year is not earth shaking or sadly, even surprising. Poor, urban areas greatly underperform their expected value based on populations. Conversely, suburbs and trendy areas overperform. From an execution perspective, this suggests that new services and more focus on linking CDFI programs, education, and mentoring to SBA lending is likely necessary.

Figure 2.
Figure 1. illustrates a comparison between Verona, Wisconsin, a suburb of Madison where Epic Systems is located and zip code 53205, an urban area of Milwaukee. Compared with Omaha or Philadelphia, or most other markets, this SBA desert is prevalent. While Wisconsin performs well in SBA lending, there are still areas of the state that are not achieving the same level of SBA support.
Pitchbook Data
Another common source of early stage data and metrics are financial metrics such as venture capital deals. In general, Chapman and Company values number of deals and average size rather than raw investment dollars for smaller communities. From a longitudinal perspective, looking at average deal size provides a more stable comparison group rather than raw investments, particularly for areas with strong energy or healthcare efforts.

Figure 3.
These areas typically will have deals that significantly shift raw investment dollars but do not necessarily affect the whole market, or even create a ton of jobs or peripheral companies. Thus, seeing an upward trend in numbers and average deal sizes is suggestive of a positive pattern. Chapman and Company’s clients in Wisconsin specifically requested that we compare Milwaukee and Madison to some other communities. Chapman and Company selected some common buoys and used a couple comparable cities selected by Wisconsin representatives.[2] Thus, Boulder and Austin do very well in deal flow metrics. These are two of the top ecosystems in the world, so this is not totally surprising. For this reason, Chapman and Company attempted to give a more direct comparison to Big Omaha (Omaha and Lincoln).

Figure 4.

Figure 5.
Here’s what Chapman and Company sees in this comparable data – heavy reliance on accelerators. Gener8tor is one of the country’s best and there are locations in both Milwaukee and Madison – also not totally surprising. However, there is a floor to this ceiling. If something were to happen to the accelerator environment in Wisconsin, the front end of the startup funding pipe would suffer some potential challenges. Therefore, strengthening and diversifying where companies enter the pipeline is probably advisable. Moreover, Madison is great at building companies that receive SBIR/STTR grants. [And Pitchbook’s data in this regard is a little spotty, so the firm used the SBIR database directly.] Converting these companies into long-term growing job creators is really important.
The other big conclusion was that while Madison is a hub for startup drug discovery activity, the entire state (and Madison) are also creating a significant number of software and IT related companies. In fact, over the last five years, Wisconsin has produced many more software companies than drug discovery companies. In short, Madison and Milwaukee are both illustrating good startup activity. Madison really is unusual for its level of activity. After visiting, Tom specifically noted some strong efforts and collaborations between the entrepreneurs, universities, and community building organizations.
BLS Data
A different way to look at economic activity is to look at jobs growth and change. Specifically, Chapman and Company utilized the Bureau of Labor Statistics OES surveys from May 2012-May 2016 and discovered some interesting findings.
Figure 6. identifies three outstanding communities regarding the employment of “COOL” jobs – (specifically STEM jobs in categories 15, 17, 19, 29 within the BLS data). Within this data, Madison produced the most new COOL jobs over the five-year period on a percentage basis – over 1.28%. This is good growth. Moreover, Milwaukee has nearly 100,000 people in these cool jobs.
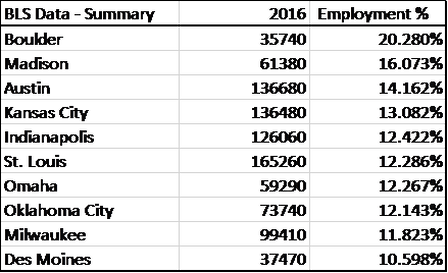
Figure 6.
This suggests a significant underlying talent and employment base. Wage strength and job opportunities are ripe in both locales. Organizations such as Northwestern Mutual and American Family Insurance are dramatically shifting their talent focus to be more open and targeted at these COOL jobs.

Figure 7.
Specifically, in our conversations, representatives of Northwestern Mutual targeted the talent opportunity in Milwaukee and its desire to create a leading talent hub for software technology. This makes significant subjective sense based on new companies, the existing clusters of automation and controls companies, and the commitment of large organizations like Northwestern Mutual.
Some noteworthy components of the actual data. Madison created 12,000 COOL jobs over the 2012-2016-time frame and Milwaukee created 4500. This level of cool job creation in Milwaukee is more positive than it appears in the specific slides because the 10-city group includes some aspirant cities, such as Boulder and Austin. Thus, having positive cool job growth is an accomplishment. Many cities were negative over this time period, and Milwaukee’s data over the last three years particuarly, is trending well. Madison’s growth is remarkable because it was the top city on a percentage basis – even with aspirant and high growth cities in the comparison group.
Inc. 5000 Data
The last comparison set was Inc. magazine’s list of 5000 fastest growing companies. Many question this data set because it is a self-selection methodology. But one key point that I like to suggest when confronted with this question is…why don’t your communities do a better job of providing applications. The reality of this is that the simple act of organizing a campaign to get more representation on the list illustrates the health of your startup and scaling ecosystem. It means that you have connected networks where communication and trust are strong. So, with that said, I think Milwaukee and Madison are both too low against what I would expect. On a per capita basis, Madison probably is about right – but not when considering the venture investment, research portfolio, and job growth. Those signals suggest that there should be more companies appearing on the list.
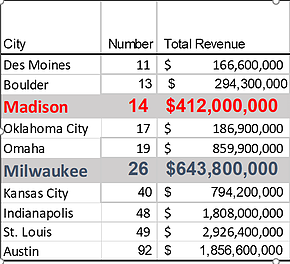
Figure 8.
Based on conversations and (frankly our expertise), Chapman and Company believes that this is tied directly to connecting startup companies to customers outside of the state or individual metro region. One key take-away for me from the information that we researched is that both communities have relatively insular networks. They would both benefit by working more together – connecting orphaned technology to customers, connecting research to entrepreneurs, and connecting startups to customers in the other market. However, more than simply working between Milwaukee and Madison, both communities would benefit from intentionally building bridges to bigger markets – such as St. Louis, Dallas, and Denver. Having early adopting customers from those regions would dramatically increase the area’s reputation and long-term US economic impact.
Jobs
The last piece that I created for this presentation was a job count for the communities. This is honestly the most dubious of my calculations – so while it should be treated as rightish…it’s probably the least dependable of my metrics. However, Chapman and Company also believes that it is critical that entrepreneurial ecosystem builders help arm their economic developers and business leaders with “comfortable” ways to think about job growth tied to the ecosystem. Traditional economic development will identify individual deals by jobs and investment…and the challenge is that individual startups often fail. Thus, tying the numbers only to individual companies can cause challenges in building momentum, policy, and strong collaboration. Thus, these numbers are aggregated across startup activity – including Inc. 5000 company data, SBA loans, and venture capital investments.

Figure 9.
So, what this jobs number reveals are the number of jobs created or retained in 2017 by startup activity in the markets measured. Notice the gap between Madison, Milwaukee, and Indianapolis. Much of this is tied to the sustainable growth of companies – not just the startup activity and venture funding. The goal should be to continue to grow companies past startup and into continued growth and sustainability.
Conclusion
Chapman and Company made seven specific recommendations to Wisconsin. Here they are without commentary. If you want more information about these recommendations or the presentations, please contact the sponsors of the events in Milwaukee and Madison. Owning outcomes and growth is up to individual entrepreneurial communities and ecosystems. We believe in Madison and Milwaukee and we hope that our efforts will encourage them to believe in themselves and the other community. If Milwaukee sparkles, all of Wisconsin wins.


[1]file:///C:/Users/Tom%20Work/Downloads/2017_Kauffman_Index_Startup_Activity_Metro_Report_Final.pdf. Read the last couple of pages where they explain methodology if you want to better understand exactly what the Kauffman Index is attempting to accomplish
[2] By the way, Scott Resnick and Chandra Miller Fienen of Starting Block Madison were terrific hosts – smart, intelligent, and funny. And Kathleen Gallagher of the Milwaukee Institute drove me around – talk about first class service. They were terrific hosts.